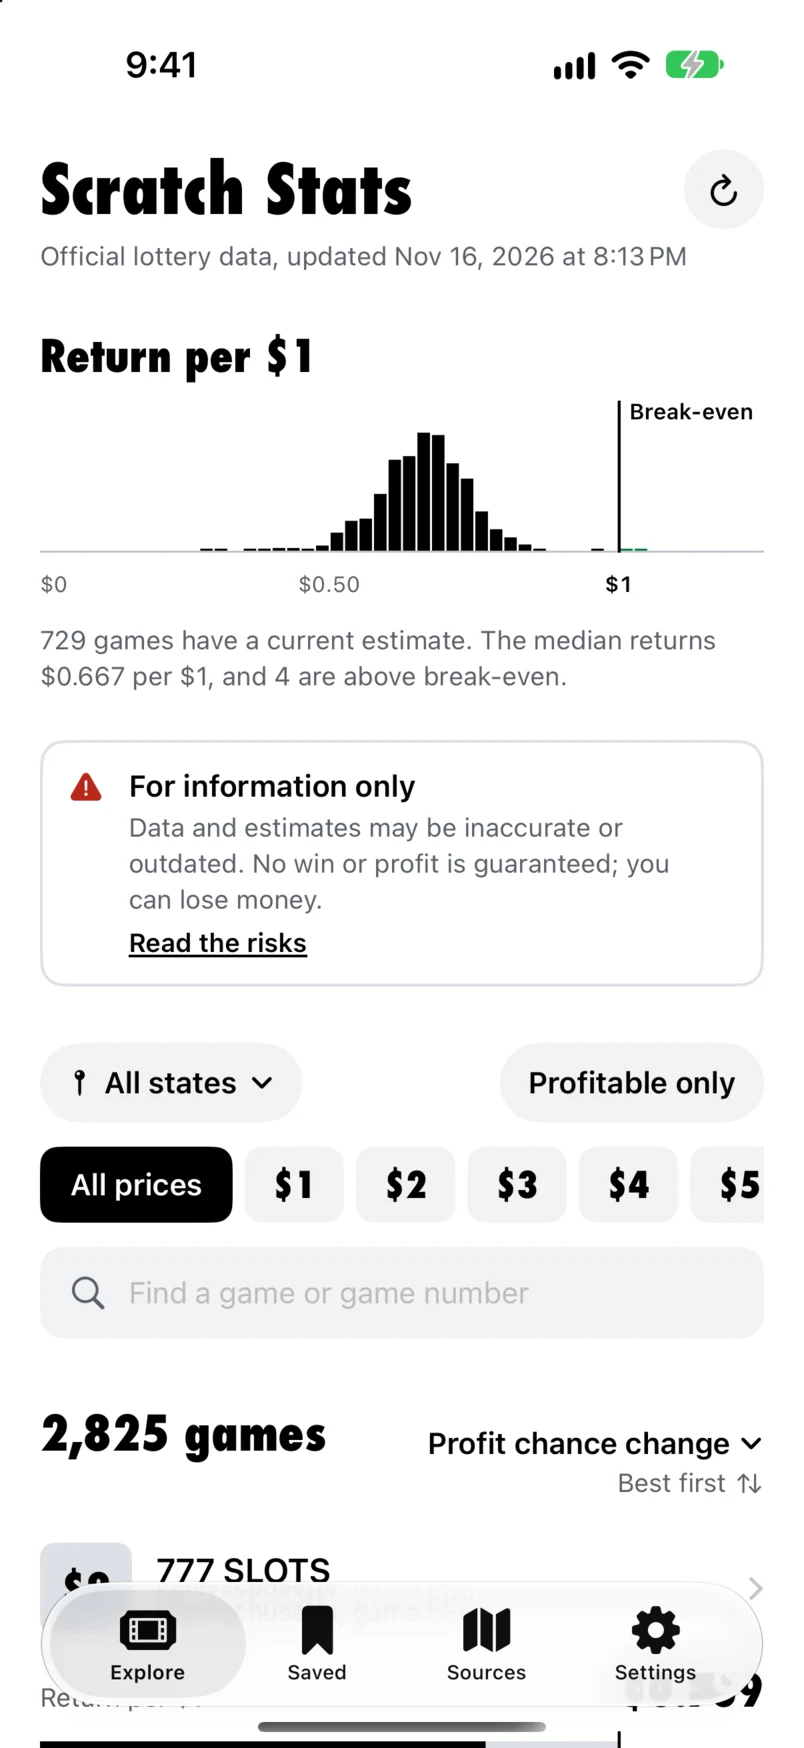
Return per $1
Compare estimated cash payout across ticket prices. Expected net value subtracts the ticket cost, so a loss stays visible.
Dollar-weighted. Before tax.
 Scratch Stats
Scratch-off data. A clearer picture.
Look past the top prize. See what’s left, compare estimated returns, and understand the numbers behind a scratch-off game.
Coming to iPhone · iOS 17 and later
See plans and the 7-day free trial for eligible new subscribers.
More than a prize count
A bigger remaining prize pool is only part of the story. Keep the chance of a win separate from the value of that win.
Compare estimated cash payout across ticket prices. Expected net value subtracts the ticket cost, so a loss stays visible.
Dollar-weighted. Before tax.
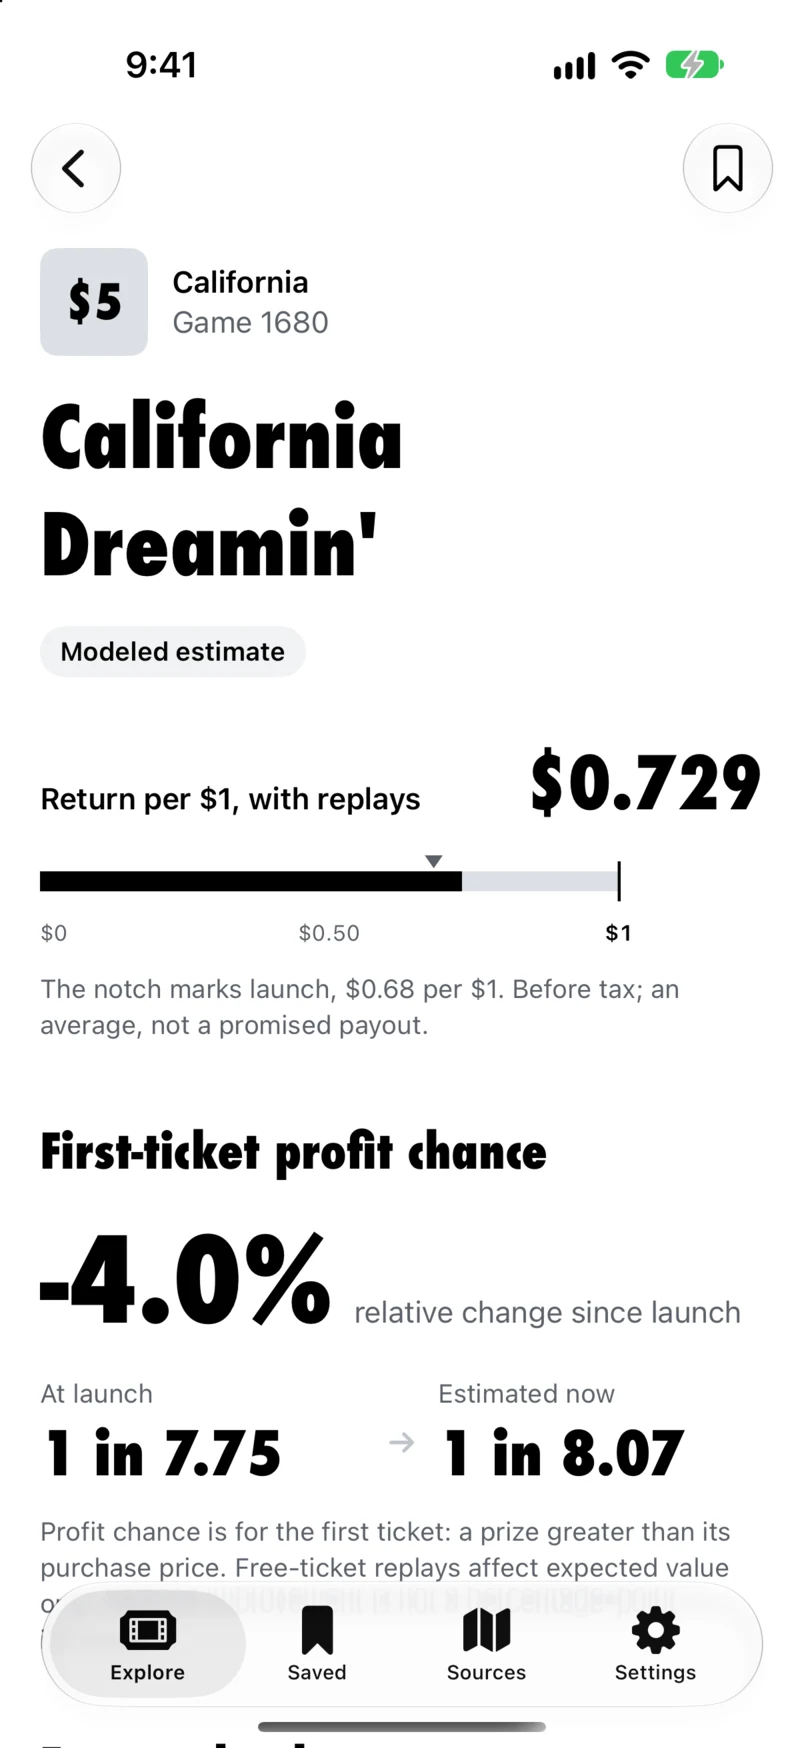
See the estimated chance of a prize worth more than the ticket, and how that chance has changed since launch.
First-ticket profit chance.
See the estimated chance of any prize, including break-even awards and free tickets, with its own launch comparison.
Winning a prize can still mean no profit.
The line that matters
A game can improve and still have a negative expected return. Scratch Stats puts the $1 break-even mark on the same scale, so the difference is clear.
Illustrative estimate: $0.73 returned per $1 means a $0.27 expected loss per dollar, before tax. An average, never a promised payout.
Make the catalog your own
Browse by state and ticket price, save games to revisit, and choose the view that answers your question.
Sort from best to worst or worst to best by return, expected net, profit odds, changes from launch, and more.
The “Profitable only” filter shows eligible games with a positive estimated net value. It’s a model result, not a prediction of your next ticket.
Optional push alerts let you know when a daily update identifies a game newly above $0 expected net value in your selected state. Enable them in Settings; existing positive games don’t create a signup backlog.
Source first. Estimate second.
Prize tables come from official lottery sources. Collection runs daily, while each lottery controls its own publication schedule. The app shows source links, observation dates, and state coverage.
Unclaimed does not mean unsold. Some unclaimed prizes may already be in purchased tickets. Remaining odds depend on a modeled ticket population unless compatible unsold counts are available.
Coverage includes a status for every U.S. state and DC. Live game availability varies by source. Failed or stale observations are excluded from opportunity signals and alerts.
Plans for launch
7 days free for eligible new subscribers. Then continue monthly or yearly. Both plans unlock the same features.
Coming to iPhone · Purchases will be in the app
Scratch Stats by Ramify Studios
A reference for understanding scratch-off data. No ticket sales, wagers, or promises of a winning ticket.
Your subscription pays for app access. It does not change the odds or guarantee a return.
Preparing for the App Store